


Britain’s Fleet Pyramid Understanding the Structure of the UK’s Commercial Vehicle Market
Executive Summary
The inaugural Britain’s Fleet Pyramid provides a comprehensive picture of how the UK’s commercial vehicle market is structured.
Drawing on analysis of 64,448 operator records and 422,199 specified commercial vehicles, the research demonstrates that while Britain’s transport sector relies on a relatively small number of nationally recognised fleet operators, it is fundamentally built upon tens of thousands of small and medium-sized businesses operating modest vehicle fleets.
The findings reveal a classic market pyramid. At its base sits a vast population of operators specifying five vehicles or fewer. As fleet sizes increase, operator numbers decline rapidly, leaving only a comparatively small group of enterprise fleets operating hundreds—or in some cases thousands—of commercial vehicles.
The Fleet Pyramid forms the second publication in the LTN Operator Intelligence research programme and establishes a benchmark that will be updated as the UK operator licence market evolves.
Key Findings
A comprehensive view of Britain’s operator licence market.
Providing a substantial data-led picture of fleet activity.
Demonstrating the scale of Britain’s SME fleet economy.
Yet they control a significant share of commercial vehicle activity.
Logistics, retail, utilities, construction, waste, food and passenger transport.
Fleet requirements evolve significantly as operators grow.
Introduction
Understanding who operates Britain’s largest fleets is only part of the story.
Equally important is understanding how the commercial vehicle market is structured. Fleet size influences purchasing behaviour, investment priorities, technology adoption, compliance requirements and operational complexity. Businesses operating three vehicles face very different challenges from organisations managing fleets of several hundred.
The Fleet Pyramid illustrates how commercial vehicle fleets are distributed across the UK and provides context for the wider transport and logistics market.
The Fleet Pyramid
The research identifies a broad base of SME operators supporting progressively smaller numbers of medium-sized and enterprise fleets.
Rather than being dominated by national operators alone, the UK market is built upon thousands of independent businesses providing regional distribution, specialist transport, construction support, utilities, passenger transport and local logistics.
As fleet size increases, so too does operational complexity, investment in technology and compliance requirements.
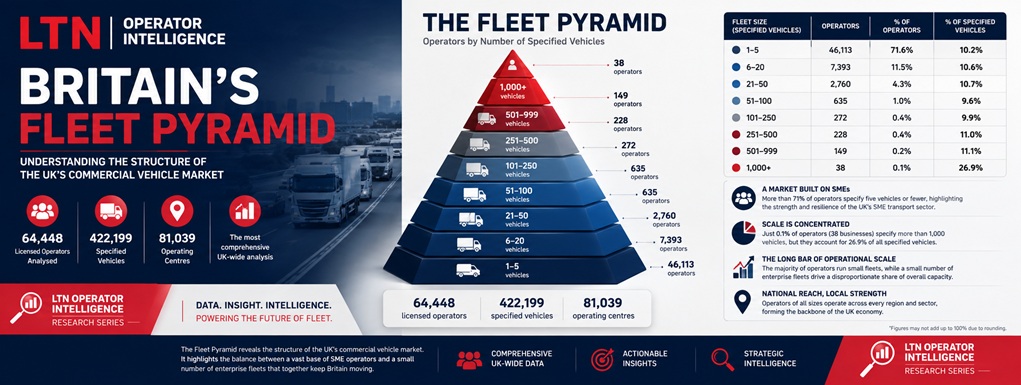
Britain’s Commercial Vehicle Market Is Built on SMEs
More than 46,000 operators specify five vehicles or fewer, highlighting the strength of Britain’s SME transport sector.
These businesses underpin regional economies and provide vital transport services across almost every industry. Although individually small, collectively they represent a substantial proportion of the UK’s commercial vehicle activity.
Enterprise Fleets Drive National Capacity
A relatively small number of enterprise operators support national supply chains, supermarket distribution, parcel delivery, waste management, utilities and passenger transport.
These organisations typically operate from multiple locations, employ large driver workforces and invest heavily in fleet technology, sustainability and operational efficiency.
More Than a Logistics Story
The Fleet Pyramid demonstrates that commercial vehicles support almost every major sector of the economy.
What the Data Means for Fleet Suppliers
The Fleet Pyramid provides practical market intelligence for suppliers by demonstrating how fleet requirements evolve as operators increase in scale.
Core Operational Essentials
Insurance, fuel cards and compliance are often the most immediate operational priorities.
Visibility & Control
Telematics, dashcams and structured maintenance planning become increasingly important.
Fleet Management Systems
Fleet software, route optimisation and workshop management systems become more established.
Integrated Technology
TMS platforms, AI analytics, depot energy, EV charging and sustainability reporting become strategic investments.
Understanding where these fleet segments sit within the market enables suppliers to tailor products, sales strategies and customer engagement more effectively.
Why the Fleet Pyramid Matters
Market Benchmarking
Operators can understand where their fleet sits within the broader structure of Britain’s commercial vehicle market.
Addressable Markets
Suppliers can identify the scale and characteristics of different fleet segments and tailor their commercial strategies accordingly.
Evidence-Based Insight
Policymakers and industry stakeholders gain a data-led picture of one of Britain’s most important operating markets.
Looking Ahead
- Fleet 100
- Regional Fleet Reports
- Sector Fleet Rankings
- Fleet Market Statistics
- Multi-Site Operator Analysis
- Fleet Growth Watch
- Operator Intelligence Profiles
Conclusion
The Fleet Pyramid reveals an industry supported by thousands of entrepreneurial businesses alongside a comparatively small number of enterprise organisations responsible for national transport capacity.
It provides an enduring benchmark against which future changes in fleet structure, investment and operational trends can be measured.
Methodology
Britain’s Fleet Pyramid has been compiled using UK operator licence data analysed by Logistics & Transport Network.
Fleet-size segmentation is based on the number of specified vehicles recorded against each operator.
Where organisations hold multiple operator licences, records have been aggregated at operator level. The research represents a snapshot of operator licence information and will be updated periodically.
Turn fleet data into commercial intelligence.
Explore operator, fleet, regional and sector intelligence from Logistics & Transport Network.